Discussion

Bias

The findings of this report are limited due to the bias of data collection being primarily United States. An interesting finding was the highly biased articles are very common in Russia. Bias is also very evenly distributed throughout the United States, showing it is a common otccurrence in news. Evenly distributed here actually is indicated by the east and west coast hosting a majority of the articles while the midwest is normally quite barren.

Conspiracy

Conspiracy articles were prevalent in the Netherlands while other categories were not. Although this is the case, most of the words found common in the sample set of articles were American focused, such as "Obama", "Trump", and "Clinton. Some other common trends found in Netherlands conspiracies were Islamic or Muslim related terminology.

Hate

Hate articles were only commonly hosted in the United States and were ironically primarily hosted in California. Political articles are well distributed in the United States with some articles hosted in the Netherlands.

Rumor

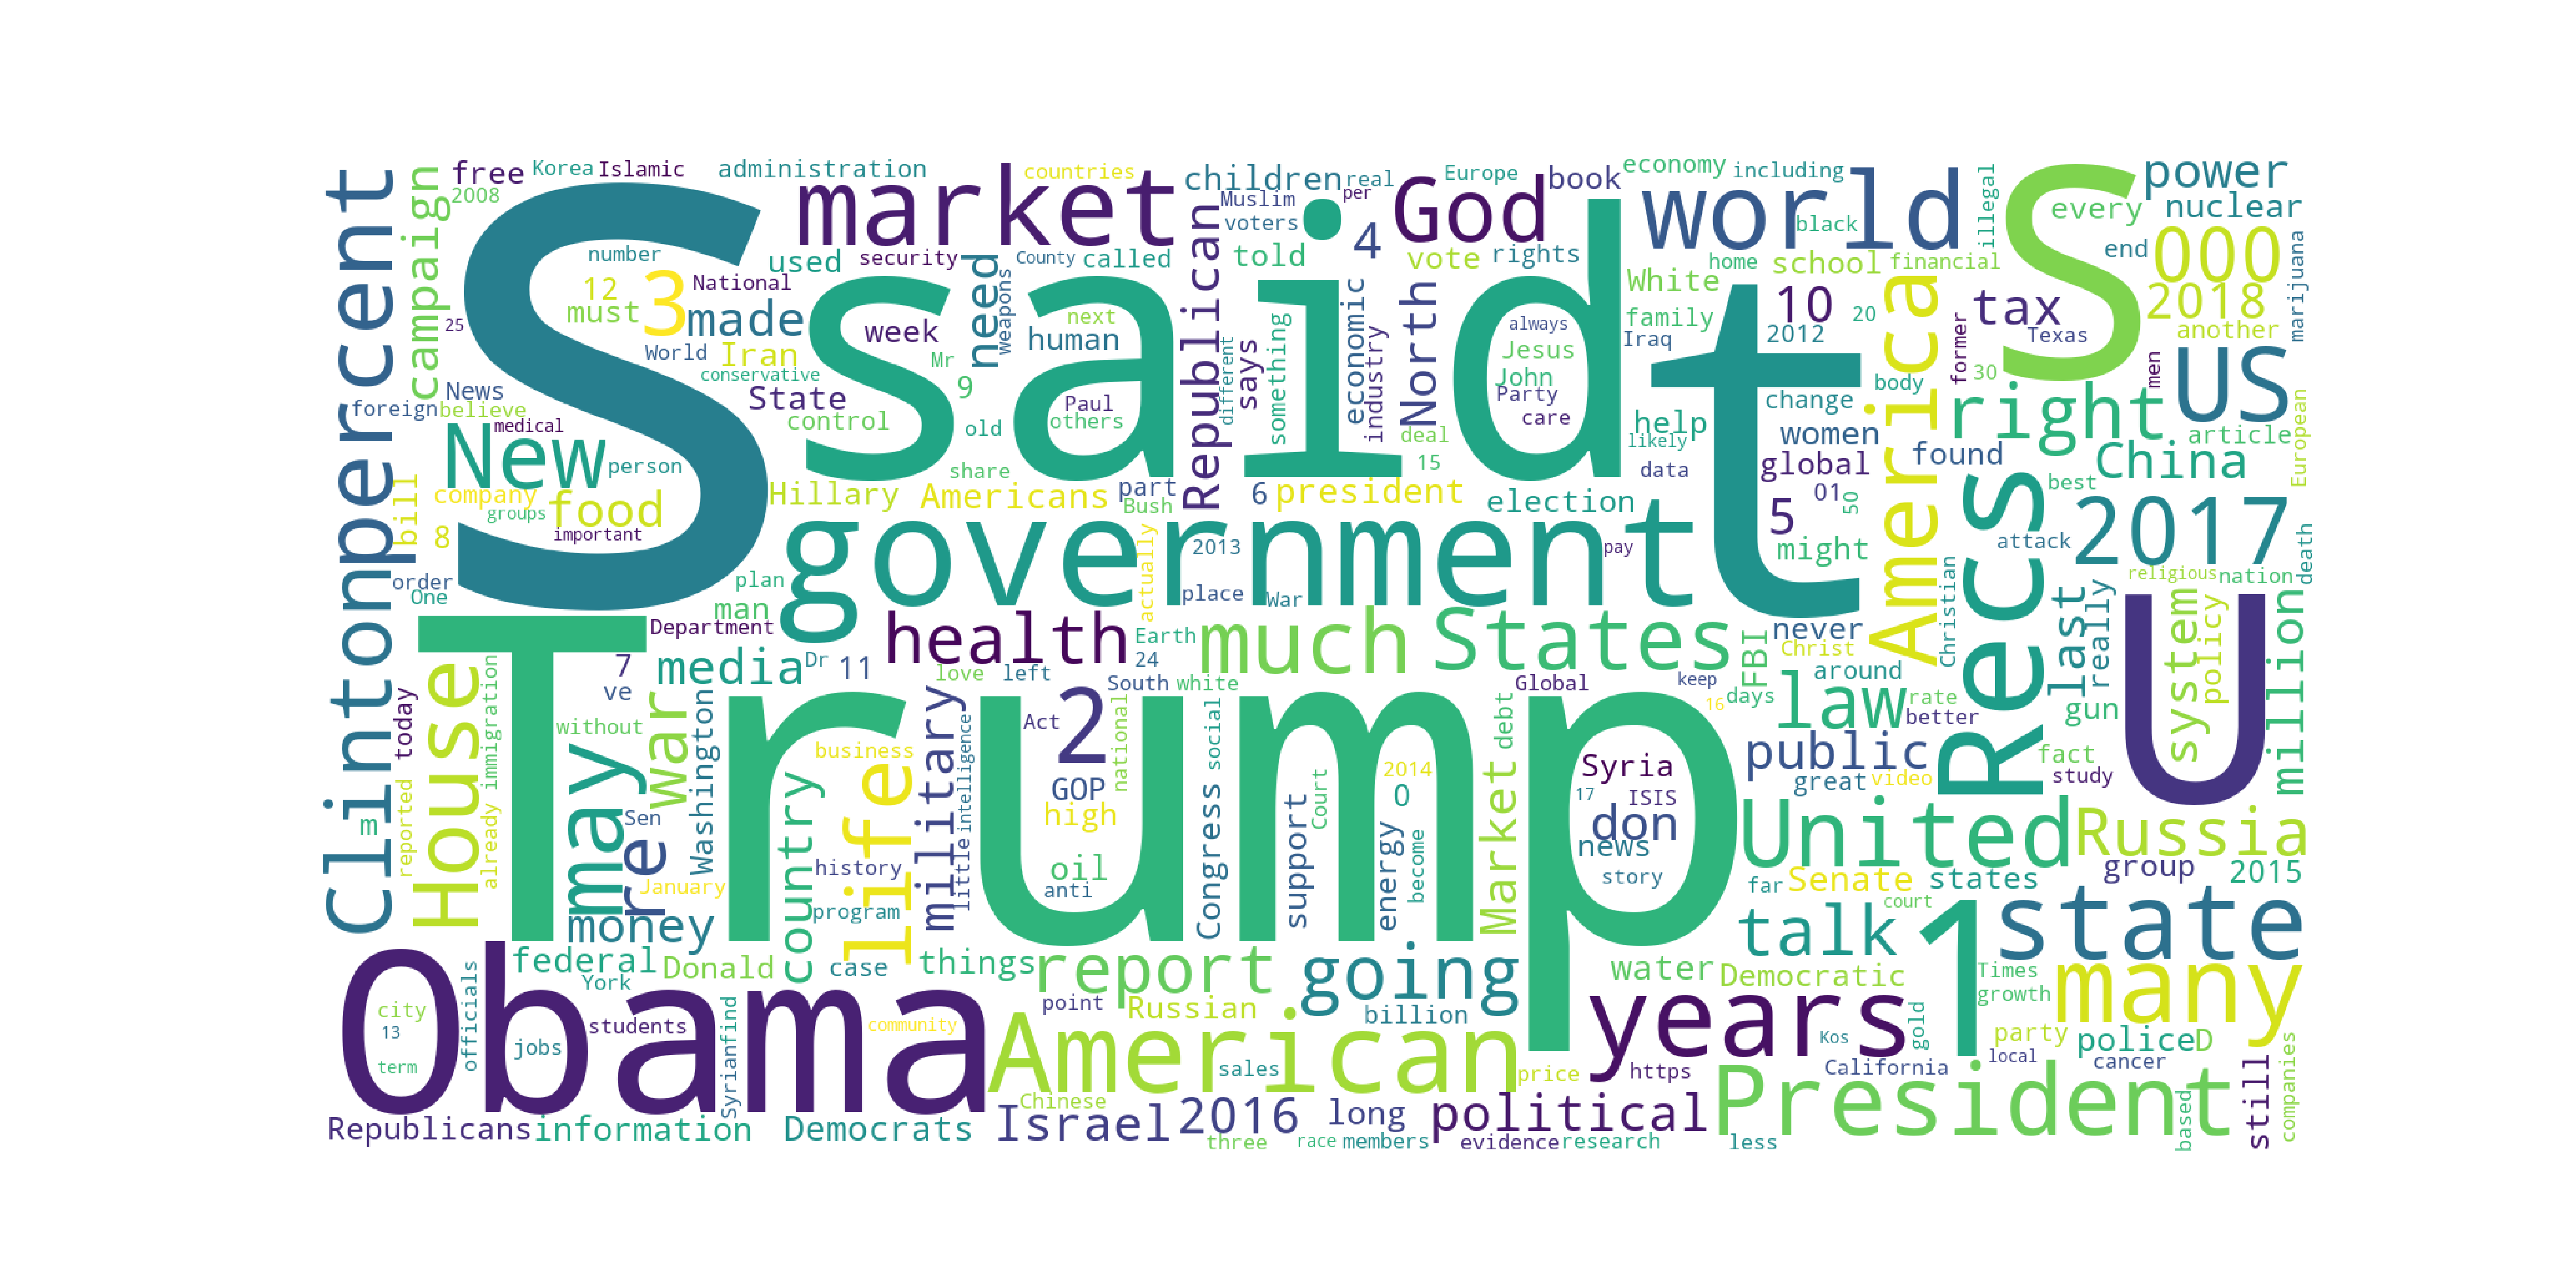
An interesting finding about articles classified as rumor, is that they are most commonly hosted in Seattle Washington, where I grew up! Some of the most common words included "Trump", "Clintom", "Obama", "Market", and "government" showing that the articles focused on rumores related to political topics.

Satire

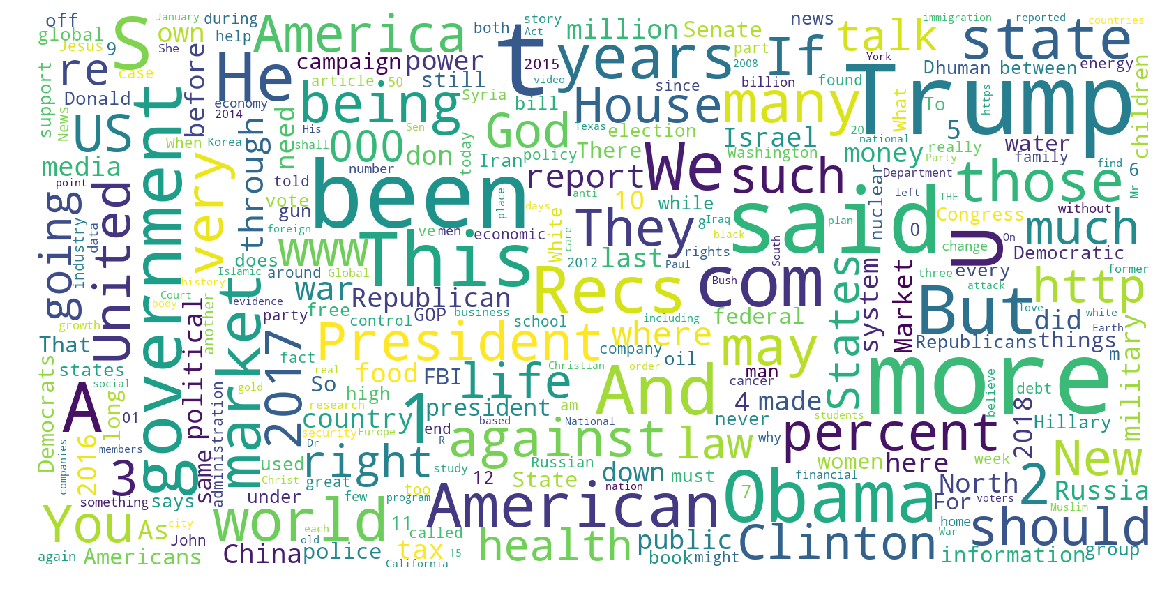
Articles classified as satire are more common amongst other countries with articles being hosted not only in the United States but also the United Kingdom, France and Germany. The word cloud generation shows mostly French language stopwords which is a limitation of this dataset. During the generation, filtering of most common words were done with a list of english common words, which is why other language like "de" and "que" became the majority. Future work here would be to include other language stop words in order to only focus on meaninful words.

Unreliable

Unreliable articles were evenly distributed throughout the United States with the most common words being politicaly focused.

Junksci

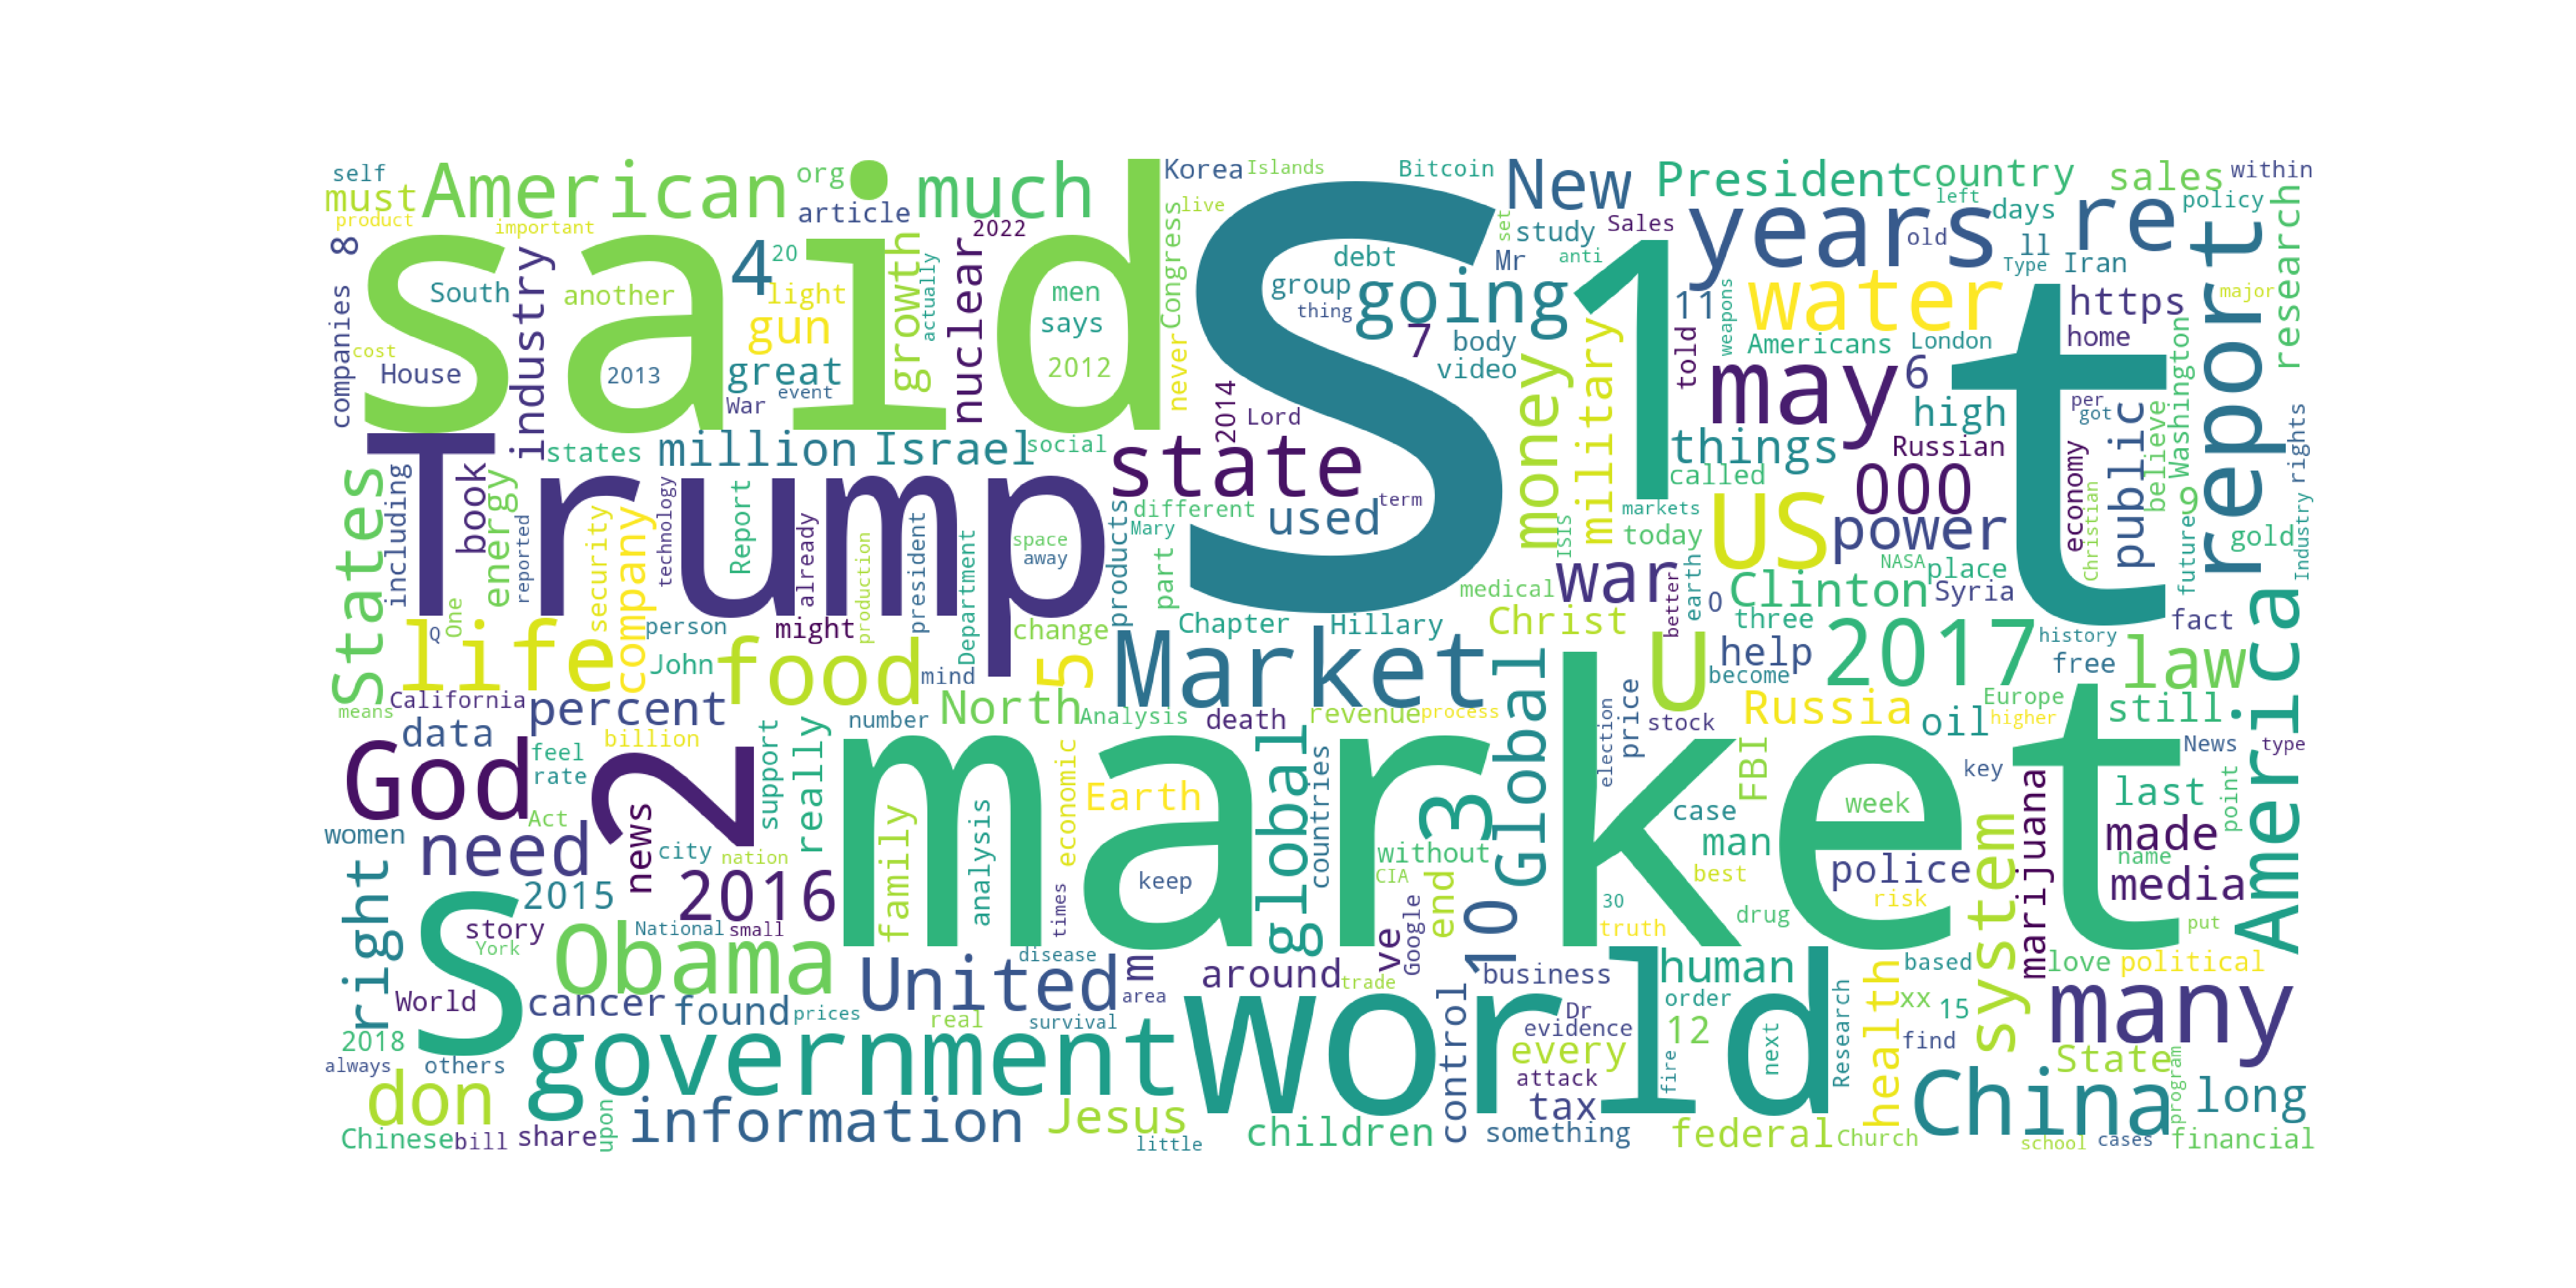
This category was the only category that showed significant differences in most common words without any mention of presidential candidates. The most common terms here were "health", "foods" and "cancer" showing that the articles are health focused which also indicates a huge problem. If these articles are not only junk, but spreading incorrect information related to health, it could lead to readers making decisions that could harm them.

Future Work

Future work in high level data summary should generate word clouds or common terminology on the full dataset in addition to other datasets to add diversity and mitigate the bias of collection being primarily from articles hosted in the US. Another important research question is how many of these websites are hosted in one country but are intended to be viewed by readers in another. An example in the dataset was a '.uk' website was hosted in the United States but is clearly intended for readers in the UK. On this note as well, collecting updates on these websites to see if their IP addresses change and to where, this could help determine if a site is unreliable and changing IP addresses in order to reduce its chances of being reported or blocked.

Future work on a deeper level should be on developing machine learning algorithms to learn the distribution of articles under each category and country. Part of this reasearch needs to take language into account as feature extraction may differ and the distributions of the articles based on language may be easier to capture seperately rather than including all languages for a class. Some models could use recurrent deep learning models to better capture the context of words in the article. Decsision trees are another option as they would help understand why a classification was made by looking at the tree splits. Finally, an adversarial autoencoder may be an an interesting model to represent the data as not only could you classify data, but you could also generate samples from the distributions it learns and either add that as new samples to a training set or use samples for future research.

Data Source and Data Preperation

Introduction

This dataset is open source and contains 11,558,723 news articles from all over the globe. The data is scraped from 1001 domains listed on opensources.co with some added in 'reliable websites', such as the NYTimes and WebHose English News Articles. OpenSources is an organization that curates data for public use, including news sources with misleading or outright fake content. They do this through a combination of means which include looking at the domain (i.e. if it contains wordpress), researching the sources, writing style analysis, aesthetic analysis, and a social media analysis. Their categorization is explained below taken from their website:

  • Fake News (tag fake) Sources that entirely fabricate information, disseminate deceptive content, or grossly distort actual news reports
  • Satire (tag satire) Sources that use humor, irony, exaggeration, ridicule, and false information to comment on current events.
  • Extreme Bias (tag bias) Sources that come from a particular point of view and may rely on propaganda, decontextualized information, and opinions distorted as facts.
  • Conspiracy Theory (tag conspiracy): Sources that are well-known promoters of kooky conspiracy theories.
  • Rumor Mill (tag rumor) Sources that traffic in rumors, gossip, innuendo, and unverified claims.
  • State News (tag state) Sources in repressive states operating under government sanction.
  • Junk Science (tag junksci) Sources that promote pseudoscience, metaphysics, naturalistic fallacies, and other scientifically dubious claims.
  • Hate News (tag hate) Sources that actively promote racism, misogyny, homophobia, and other forms of discrimination.
  • Clickbait (tag clickbait) Sources that provide generally credible content, but use exaggerated, misleading, or questionable headlines, social media descriptions, and/or images.
  • Proceed With Caution (tag unreliable) Sources that may be reliable but whose contents require further verification.
  • Political (tag political) Sources that provide generally verifiable information in support of certain points of view or
  • political orientations.
  • Credible (tag reliable) Sources that circulate news and information in a manner consistent with traditional and ethical practices in journalism (Remember: even credible sources sometimes rely on clickbait-style headlines or occasionally make mistakes. No news organization is perfect, which is why a healthy news diet consists of multiple sources of information).
count
type
bias 1138998
clickbait 231949
conspiracy 831235
fake 894746
hate 76496
junksci 117467
political 2420066
reliable 1913222
rumor 481158
satire 112948
unknown 371518
unreliable 298784

Within the dataset there are also domains, content, url, tags, summary, source and more. There are 775 unique domains in the dataset, which in reality brings the variability of the dataset down. There is also information on when the article was scraped, inserted and updated at, but time was not used in this analysis.

['domain_x',
        'type',
        'url',
        'content',
        'scraped_at',
        'inserted_at',
        'updated_at',
        'title',
        'authors',
        'keywords',
        'meta_keywords',
        'meta_description',
        'tags',
        'summary',
        'source',
        'updated_domain',
        'city',
        'country',
        'domain_y',
        'ip',
        'iso_code',
        'latitude',
        'longitude',
        'postal_code',
        'subdivision',
        'subdivision_iso_code']

Adding Host Information

Unfortunately the dataset does not contain any information on the general location in the world of where the article was hosted. Understanding the global dispersion of misinformation is potentially useful information, which is why I chose to investigate it. Using the below code and a free MaxMind account, I was able to use the associated domains to get information on the website the article was hosted on. MaxMind is a providor of location data based on IP addresses.

The methodology was to extract the domain from the provided url's because not all values in the domain column had a domain present, then look that domain up using a package in python to return the IP address, then submit that to the MaxMind API and receive iso information, subdivision information, city, postal code, and longitutude and latitude coordinates.

def maxmind(mydict):
        client = geoip2.webservice.Client(132485, '<insert key>')
        try:
        response = client.insights(mydict['ip'])
        mydict['iso_code'] = response.country.iso_code
        mydict['country']  = response.country.name
        mydict['subdivision'] = response.subdivisions.most_specific.name
        mydict['subdivision_iso_code'] = response.subdivisions.most_specific.iso_code
        mydict['city'] = response.city.name
        mydict['postal_code'] = response.postal.code
        mydict['latitude'] = response.location.latitude
        mydict['longitude'] = response.location.longitude
        return mydict
        except Exception as e:
        logging.error("Failed to get ip for {}".format(mydict['domain']))
        return

        def main(df):
        results = list()
        domains = list()
        for  url in df['url'].values:
        if isinstance(url, float):
            domains.append(url)
        else:
            domains.append(urlparse(url).hostname)
        domains = list(set(domains))
        pool = multiprocessing.Pool(multiprocessing.cpu_count())
        for domain in domains:
        mydict = dict()
        if isinstance(domain, float) and domain > 0:
            mydict['ip'] = domain
            mydict['domain'] = nan
            results.append(pool.apply_async(maxmind, (mydict,)))
        elif isinstance(domain, str) and domain != "nan" and domain != "NaN":
            mydict['domain'] = domain
            try:
                ip = socket.gethostbyname(mydict['domain'])
                mydict['ip'] = ip
                results.append(pool.apply_async(maxmind, (mydict,)))
            except:
                pass

        pool.close()
        pool.join()
        data = [r.get() for r in results]
        new_df = pd.DataFrame(data=data, index=range(len(data)))
        new_df.to_csv(os.path.join(dir, 'domain_locations.csv'))
        

This provides useful information but is not entirely reliable. A website based in one country could easily be hosted somewhere else in the world, but this is a limitation all research on web crawled datasets expereince. Keeping this in mind, the data was then aggregated by country to get an idea of how often a category was present by country.

:
group_by_country_category = df.groupby(['country', 'type']).type.count()
        pd.DataFrame(group_by_country_category)
        
type
country type
Australia fake 2
satire 1694
British Virgin Islands bias 7
fake 11
reliable 1730
unknown 7
Bulgaria fake 1
Canada bias 234
clickbait 350
conspiracy 38043
fake 180
junksci 300
political 27190
satire 427
unknown 70010
unreliable 1479
Estonia unknown 1856
France fake 28
satire 55
unknown 130
Germany clickbait 30
conspiracy 135
fake 96
satire 1408
unknown 1121
unreliable 2140
Iceland conspiracy 32
Netherlands bias 1038
conspiracy 82948
fake 39
political 7150
unknown 6171
unreliable 25488
Norway unreliable 8792
Russia bias 475794
Seychelles unreliable 173571
Singapore bias 5
reliable 1408
Switzerland fake 1
Turkey fake 31
United Kingdom fake 1
satire 5347
unknown 87
United States bias 660084
clickbait 231569
conspiracy 710024
fake 891808
hate 76496
junksci 117167
political 2385726
reliable 1909275
rumor 481158
satire 104017
unknown 290176
unreliable 87314

As you can see, the data is highly biased in that most of the articles are from the United States, which would mean that ana analysis should focus on the United States, but I still pursued visualizing the dispersion of the dataset throughout the world in addition to the USA.

Generating Maps

The maps were generated using the Plotly javascript library and a scatter map was the decided format. With the scatter map, the size of the dots are decided by the number of articles in that region. Due to a highly skewed dataset from region to region, the size of the dots are determined by the log of the count of files. This improved the ability to compare regions without losing visibility of what would normally be really small data points. The map type was Mercator because although Mercator projection distorts the size of certain objects as the latitude increases from the Equator to the poles, the dataset is focused in regions that are less distored, unlike areas such as Greenland and Antarctica.

Word Clouds

The word clouds were generated using a python package called 'wordcloud' and by passing a dictionary of word and word counts. These word counts were calculated on a sample set of 100,000 articles due to the expense of processing and time it would consume. This process would be optimized using more decentralized methods such as Apache's MapReduce or Spark. Word clouds were generated for all countries in the sample, all categories, and all country and category combination. Very common words were filtered out in order to optimize the meaninfulness of the words that were generated in the word cloud.

from collections import Counter
        import re
        from collections import OrderedDict
        from operator import itemgetter
        import numpy as np # linear algebra
        import pandas as pd
        import matplotlib as mpl
        import matplotlib.pyplot as plt
        from subprocess import check_output
        from wordcloud import WordCloud, STOPWORDS
        import multiprocessing
        import gc

        def top_words(series, name):
        main = dict()
        for string in series:
        if isinstance(string, str) and len(string) > 1:
            words = re.findall(r"[\w']+", string)
            words = Counter(words)
            words = OrderedDict(sorted(words.items(), key=itemgetter(1), reverse=True))
            words = {k: v for k, v in words.items() if v > 2 and k.lower() not in STOPWORDS}
            main = {k: words.get(k, 0) + main.get(k, 0) for k in set(words) | set(main)}
        return {name: main}

        def plot_word_cloud(words_dict, country):
        mpl.rcParams['font.size']=12                #10 
        mpl.rcParams['savefig.dpi']=300             #72 
        mpl.rcParams['figure.subplot.bottom']=.1
        words_dict = dict(words_dict)
        for word in commonwords_list:
        if word in words_dict.keys():
            del words_dict[word]

        stopwords = set(STOPWORDS)
        wordcloud = WordCloud(
                              background_color='white',
                              stopwords=commonwords_list,
                              width=1600,
                              height=800,
                              max_words=300,
                              random_state=42
                             ).generate_from_frequencies(words_dict)

        print(wordcloud)
        fig = plt.figure(1)
        plt.figure( figsize=(20,10) )
        plt.imshow(wordcloud)
        plt.axis('off')
        plt.savefig(os.path.join(data_dir, country+"wordcloud.png"))
        plt.show()

        pool = multiprocessing.Pool(multiprocessing.cpu_count())
        wordfreqs = dict()
        for country in country:
        results = dict()
        for content in df[df['country'] == country]['content'].values:
        results.append(pool.apply_async(top_words, (mydict,)))
        pool.close()
        pool.join()
        wordfreqs['country'] = [r.get() for r in results]

        print "Done"
        
results = []
        total = []
        # fake, bias, political, hate, clickbait, conspiracy, junksci,reliable, rumor, satire, unknown, unreliable
        temp = df[df['type']=='unreliable']
        pool = multiprocessing.Pool(multiprocessing.cpu_count())
        for country in countries:
        results.append(pool.apply_async(top_words, (temp[temp["country"]==country]['content'].values, 'world')))
        pool.close()
        pool.join()
        world =  [r.get() for r in results]
        gc.collect()
        for idx, mydict in enumerate(world):
        try:
        plot_word_cloud(mydict.values()[0], mydict.keys()[0])
        except:
        pass
        

Why Fake News Matters

Problem

Fake News is a hot topic in today's conversation, with rigged political elections, Russian propaganda, gun laws and many other topics being targeted as content for fake news or manipulation. A poll conducted by Morning Consultant found that 41% of people in their survey turn to social media for their news , a major source of fake news propagation. This same study found that 58% of people in their study have seen fake news on social media, with only 37% thinking they have seen fake news. Keep in mind, this is all subjective in that there was no checking if the sources they said were fake were indeed fake, but still demonstrates awareness and concern over the spread of misinformation.

Motivation: Available Datasets

As fake news evolves in a sophisticated manner, the solutions to mitigate the effects of the spread and resulting manipulation will need to also evolve in a sophisticated manner. As a result, several organizations have provided publicly available datasets with articles categorized under multiple categories such as bias, news, propaganda and more for researchers to use towards developing a detection or classification system for catching 'fake news'. This has been motivated by the clear need to solve the growing concern. This page explores just one of these datasets, hoping to bring some findings to the distribution of different types of news.

Approach: Understanding the Source

Part of the sophistication behind fake news is the way the articles are hosted. The dataset chosen for this dashboard contains the URL that the article was scraped from. Using this URL, the hosted IP address can be optained and an approximate location of the IP address can be determined. The goal is to visualizat where certain types of articles are being primarily hosted from or if they are wildly distributed, demonstrating a bot-like process.

This is a word cloud of all articles found in this country.

This is a word cloud of all articles under this type.

This is a word cloud of all articles under this type in the chosen country.

United States 2018

United States All Content

* This is a word cloud of articles in the United States under this category.